BI Dashboards
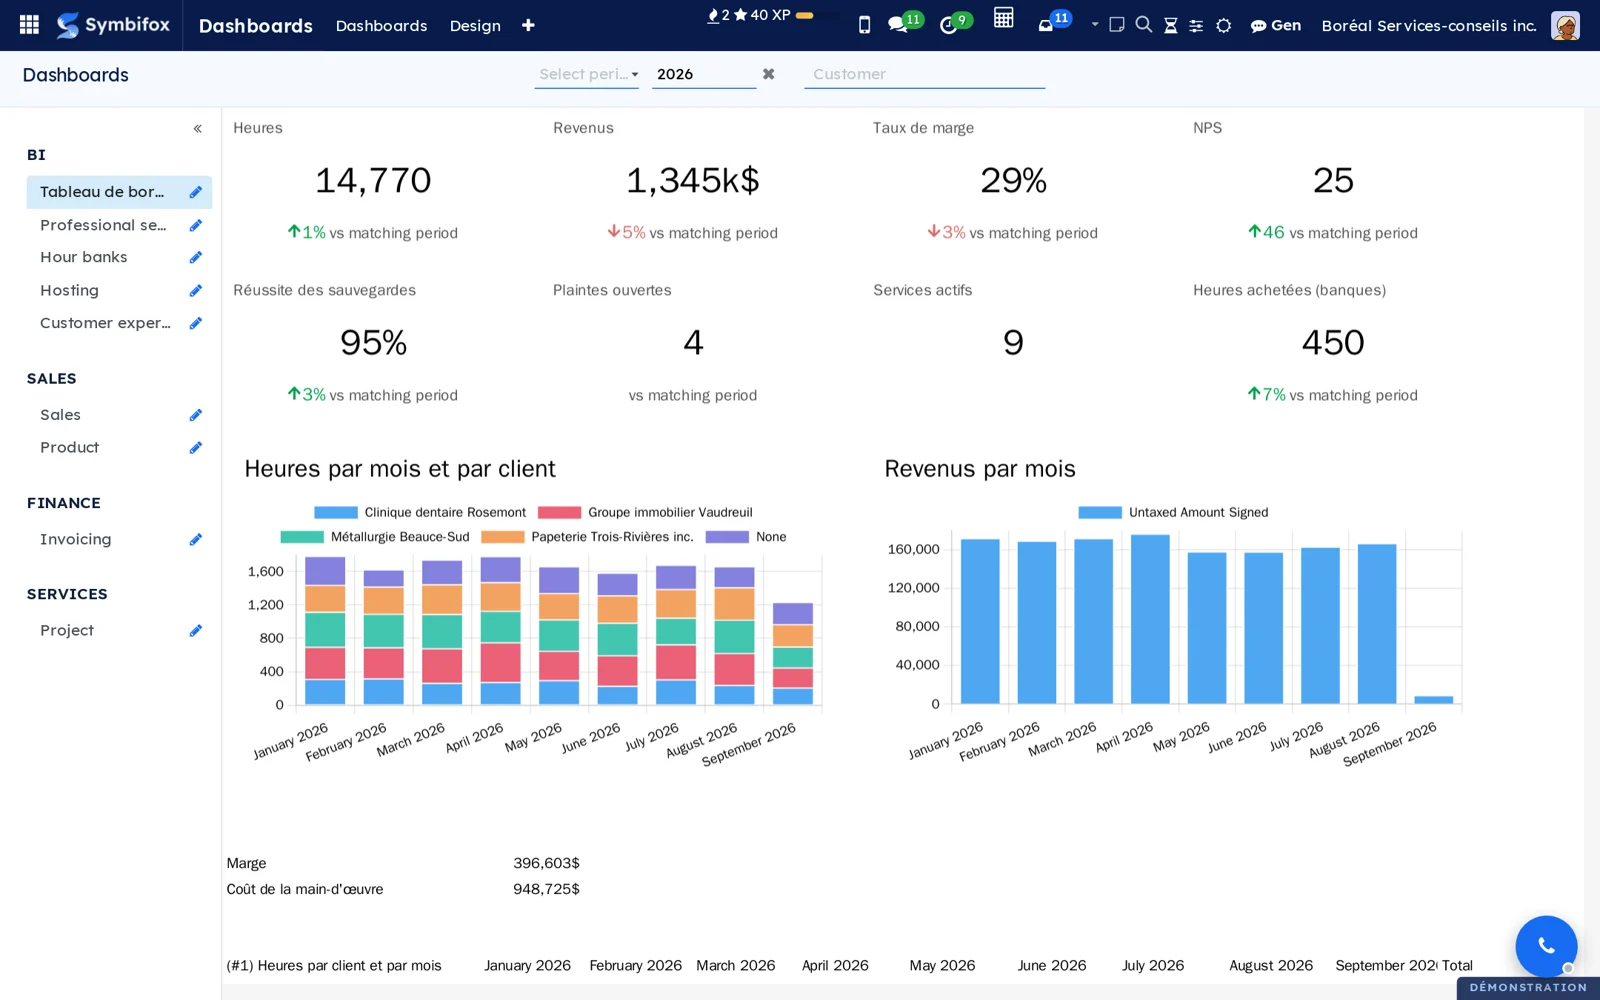
Dashboards designed on screen, inside Odoo, where each person only sees their own figures.
Odoo Community reads dashboards but cannot design them: the editor is an Enterprise feature. And a BI tool plugged in beside Odoo reads the database without its access rights, which then have to be rebuilt by hand, or dropped.
Here you build the dashboard on screen. A pivot or graph view, anywhere in Odoo, goes to a dashboard through “Add to a dashboard”, as a table, a chart or a tile. The Period and Customer filters are created for you and apply to the whole page. The editor saves itself, and never overwrites the version a colleague has just saved.
Named measures (margin, billable hours, NPS) are defined once and used everywhere. ⚠️ Every figure is recomputed for the person looking, under their own access rights: a consultant sees their hours, management sees everything, in the same dashboard. A tile compares the year to date with the same dates last year, not with the whole year.
Your other figures come in as external sources: an Excel workbook uploaded or kept in Nextcloud, OneDrive or SharePoint, a Google Sheets spreadsheet, a web API (JSON, CSV or OData), a PostgreSQL database or a Grist document. Each source is closed by default and opened to the groups you choose, read live with no copy in Odoo, and its keys are seen by administrators only. A named measure can add up a workbook column: management's budget then sits against actuals, by month and by customer. Ready-made dashboards install themselves with the modules they read.
Comparable to Power BI or Tableau, without copying the database beside Odoo or rebuilding its access rights by hand
5 add-on modules
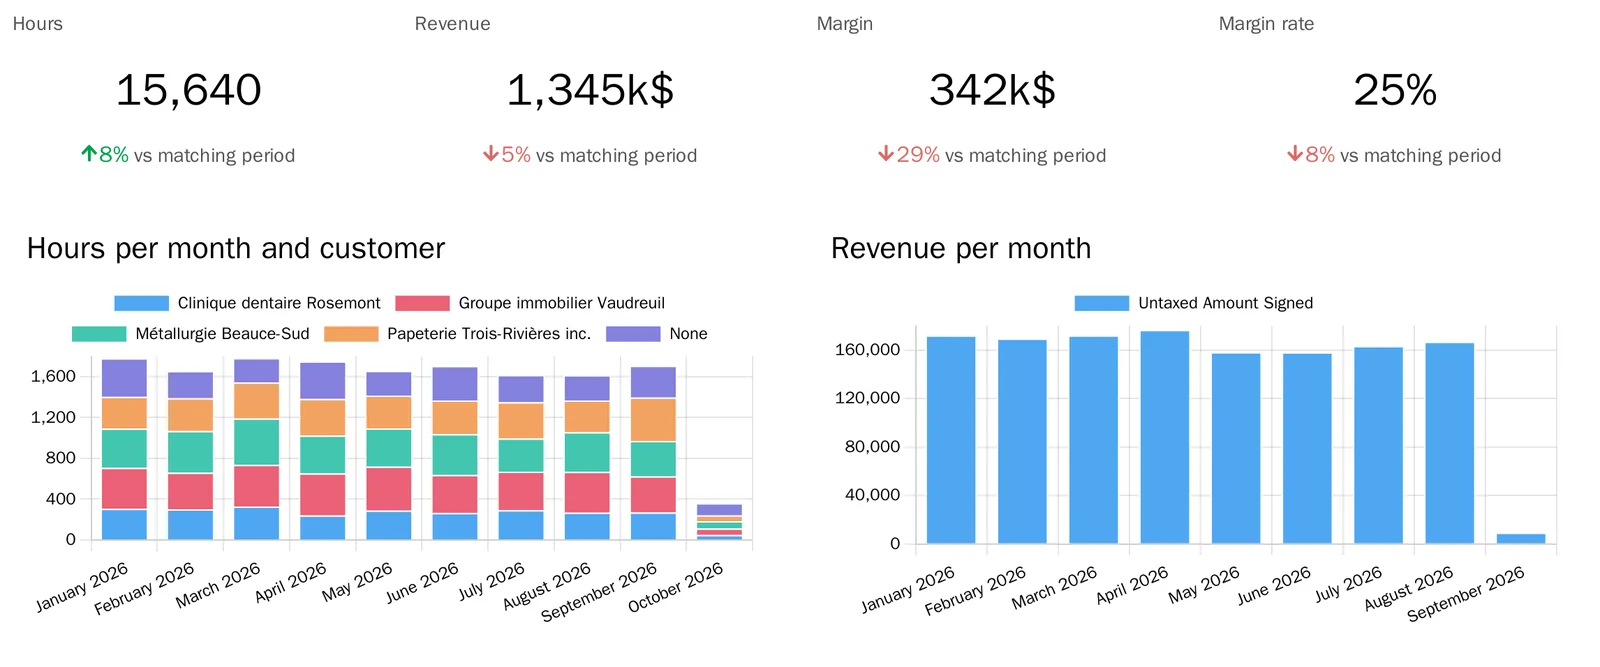
Professional servicesHours, revenue, labour cost and margin, by customer and by month.
The Professional services dashboard and its named measures: hours entered on projects, invoiced revenue net of credit notes, labour cost from each person's hourly cost, margin and margin rate. It installs itself when timesheets and invoicing are present. The margin rate moves in points, not as a percentage of a percentage.
Hour banksYour customers' hour bank balances, and the hours added or removed.
The Hour banks dashboard: balances as the hour bank module computes them, and the hours added or removed over the period. It installs itself with hour banks, and is reserved to people who can read them: nobody gets a tile in error.
HostingServices in production, services down, backup success, storage and expiring domains.
The Hosting dashboard and its measures: services in production and those whose last health check failed, backup runs and their success rate, average share of storage used, domains whose registration ends within 90 days. It installs itself with hosting management.
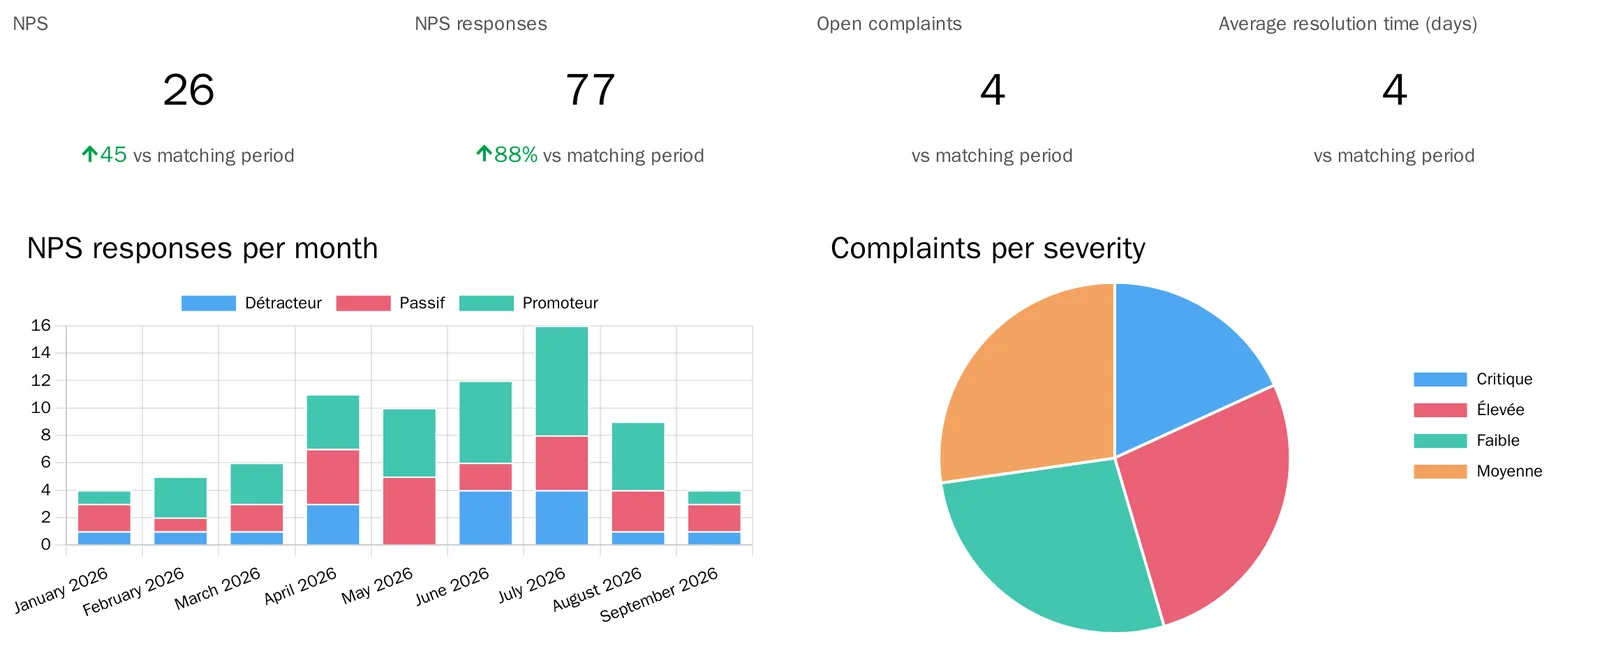
Customer experienceNPS, responses, open complaints and resolution time.
The Customer experience dashboard and its measures: answers to the NPS question, promoters, detractors and NPS, complaints received and not yet resolved, average days to resolve a complaint. It installs itself with the customer experience suite. NPS moves in points.
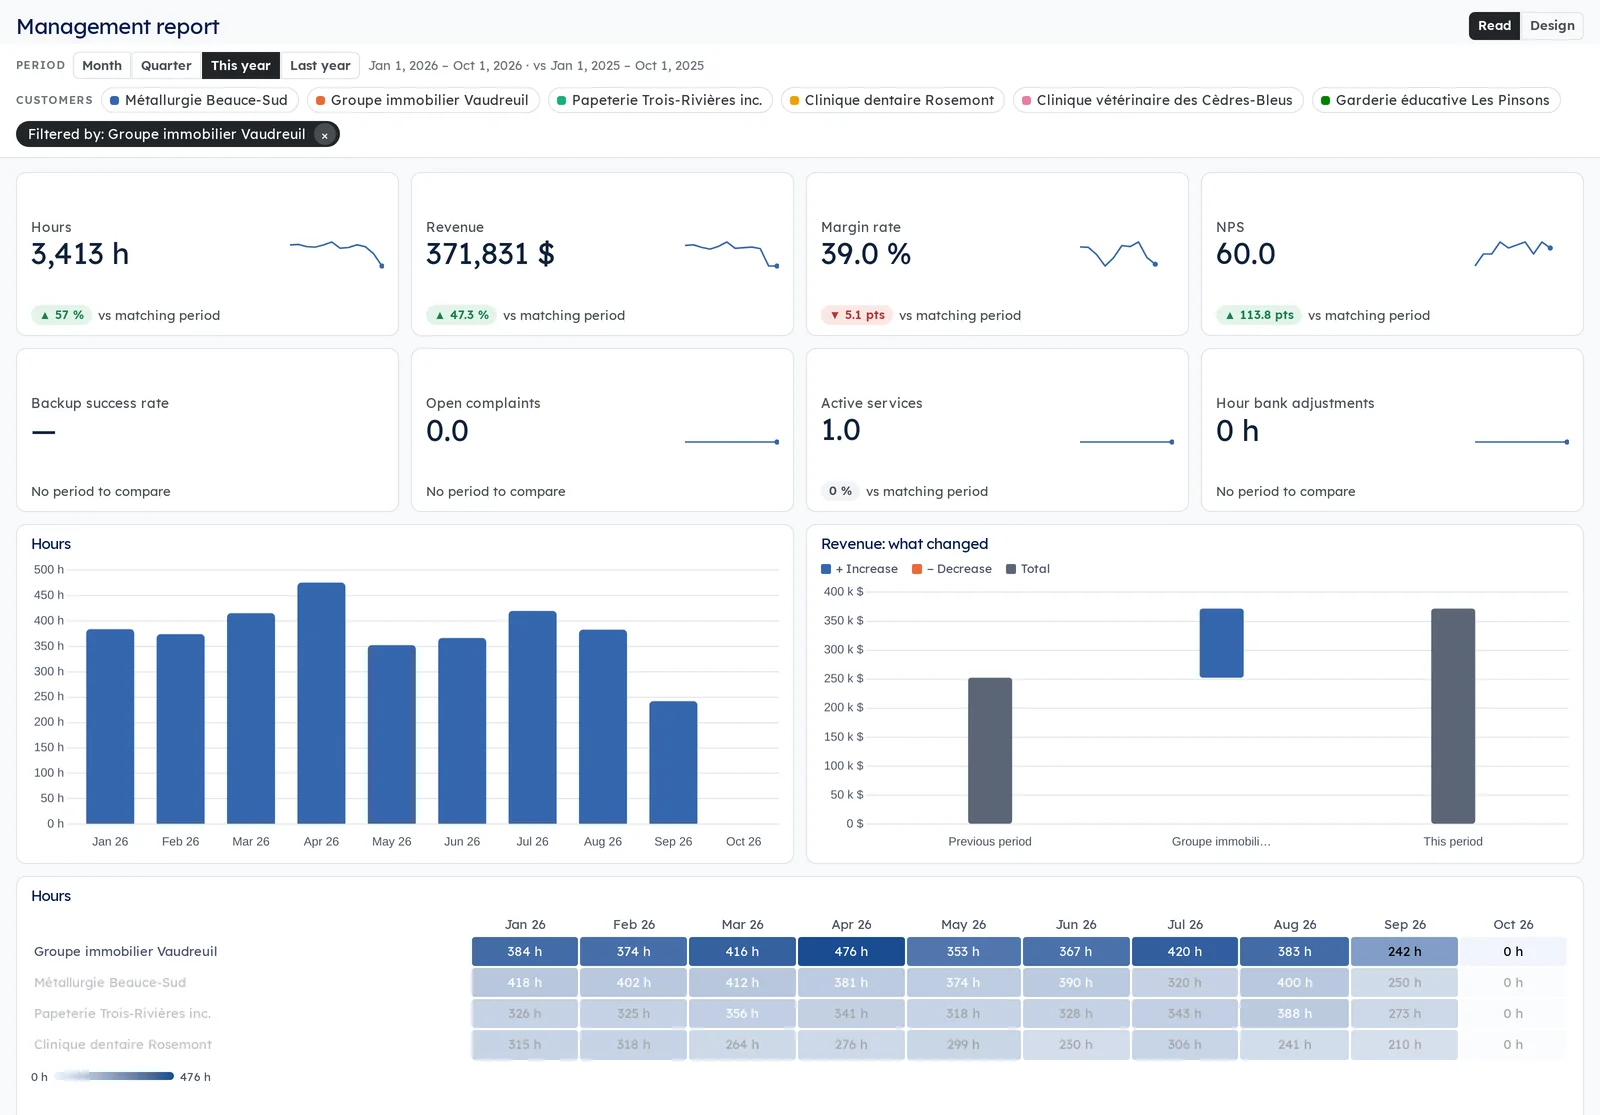
Interactive reportsReports that read like Power BI: slicers at the top, a click that filters the whole page, a detail page for each customer.
Period and customer slicers at the top of the page, and every visual follows them. A click on a bar, a slice or a row filters the whole page, and a right-click on a customer opens its detail page.
Tiles compared with the matching period, column, line and donut charts and tables, but also gauges with their target, waterfalls that explain a change customer by customer, and heat maps of customers month by month, in your company's colors if you like.
Designers build a report on screen: drag a measure, move, resize, with a history of the last 30 versions. Five reports come ready to use: management, time and margin, customer experience, hosting, hour banks.
The figures are the dashboards' named measures, computed under the access rights of the person looking: nobody sees a figure in a report that they could not read elsewhere.
Shall we look at your case together?
Tell us what you run today. We will tell you honestly whether Symbifox helps or not.
The catalog grows almost every month.
What gets added, what we learn deploying it, and nothing else. You leave whenever you want.
One confirmation email, and nothing before you follow its link. Then 10 welcome emails, one a week, then the updates. No tracker, no resale.